Wednesday, December 10, 2014

Taking Polls and Grading Quizzes

Interactivity is a cornerstone to creating engaging, dynamic Excel workbooks and tools.  Option Buttons are one way to add this ability to your Excel creations, and make them more professional in the process.

Option Buttons can also be very useful in creating Quizzes in Excel, and although they can at first appear a little intimidating, they are really not too difficult to create.  The following is a step-by-step explanation of how to create your first quiz using Option Buttons:

1.   Add the Developer tab on your toolbar:

a.   Click the File tab and then click Options, and then click the Customize Ribbon category.

b.   In the Main Tabs list, select the Developer check box, and then click OK

2.   Under the Developer tab, choose Insert/Form Controls/Option Button

3.   Draw the Option Button box on your worksheet and repeat for however many buttons you wish to have for choices

4.   Now, (this is Important), to make the buttons work together, return to your Insert dropdown and choose Group Box from the Form Control group

5.   Then draw your Group Box all the way around your Option Buttons

Three More Steps, and We are Done:

6.   Right-Click one of the Option Buttons, choose Format Control from the dropdown and select a Cell Link that you want your Option Buttons to populate

7.   Now comes the Cool Stuff: Create a Formula that is based on the value that is shown in the Cell Link

8.   For example, let’s say you have linked three Option Buttons to Cell $E$5 and you wanted Option 2 to return a “Correct” response and the others to return “Incorrect”, here is what you do:

In cell E6, type =IF(E5=0,"", IF($E$5=2, "Correct!", "Sorry, Incorrect"))
 
 
Now when the quiz-taker chooses Answer 2 of the three possible, they are rewarded with the “Correct!” feedback.  Option Buttons, another way to make Excel do things you never thought possible!

Thursday, December 4, 2014

The Cloud Rules!

Let’s face it, tablets and so-called phablets (a term I find curiously disturbing) are where the world is today, and there is an ever-increasing amount of Real Work done on these devices.

The Cloud is making all of this practical and efficient, and this is very much the case with Excel.  When it comes to Microsoft, OneDrive has replaced the previously-called SkyDrive, and it has become easier and more intuitive than ever to use.
 
By placing your Excel workbooks on OneDrive, they can be shared on any of your devices.  All you need to do is save your Excel file to your OneDrive and it is there whenever and wherever you need it.  Since I commonly switch from a conventional PC to a laptop to an iPad during the day, I am finding the capacity to do this a Great Convenience!  
 
That’s not all, of course.  In addition to easily saving your Excel masterpiece to OneDrive and accessing it on your other devices, you can also Share It with the World if you so choose.  Simply click Share on the left panel, save it to OneDrive and then complete the Invite People feature to provide them access to your work.  What makes this Especially Cool is that the other parties with whom you are sharing Do Not even have to have Excel on their computer!  This is a great attribute, as not everyone has Excel on All of their devices (the Luddites – Ha!).

Since the learning curve is now not at all steep for creating/modifying Excel workbooks on tablets, the opportunity is presented to not only share your work, but also work on your work while on a tablet, phablet, or maybe in the not-so-distant future, on a smartphone (of course, this may require some very keen eyesight…).  Is it all about work, work, work, you say?  Well, perhaps you have a point.  In my next blog I’ll show you something really Fun (and perhaps a bit useless) to do in Excel.

 
Cheers!

Wednesday, November 26, 2014

MicroGraphs for All!

As many of you may know, “Sparklines” first appeared in Excel 2010.  Sparklines make it quick and easy to create readily-intelligible micrographs within the cells of your Excel spreadsheets that highlight important details of your data.  They have the same utility as traditional graphs and charts, but they have the additional benefit of being incorporated right next to the data which you wish to illustrate.

Well, that’s pretty cool, but what if your company is still using Excel 2007 or even Excel 2003, (a recent survey showed a significant number of companies still using these older versions), and you want to use some Cool Little Micrographs on your spreadsheets?  What can you do?

A very effective way to make these engaging little graphs is to incorporate an unpretentious formula and a touch of conditional formatting.  Let’s look at how this can be done…

Let’s say you have the Producers of your company’s products in Column A as illustrated below, and in Column B you have the Units Sold each producer has sold. Here is the simple formula you should put in Cell C2 (and then copy it to C8):

= REPT( “l” , B2/1,000) 


For each Approximate Count of One Thousand, the formula puts an old-fashioned Hash Mark, (using a bold, simple font works well), in Column C. With a bit of Conditional Formatting, the result is a clean, professional report that integrates a MicroGraph! Using these elementary graphs makes your data Visually Comprehensible and enhances the user’s understanding of what is being said in your Excel reports.

If you are using a pre-2010 version of Excel (or even if you are using a more contemporary version), try it out sometime and see what you think. It’s good stuff!

Happy Thanksgiving All!

Wednesday, November 19, 2014

Sales Analysis with Coefficient of Determination


The correlation of data can be an extremely worthwhile endeavor for any business analyst. Adding some graphical depiction of your analysis can make it even better.

One of my favorite charts and accompanying functions are Scatterplot (XY) Chart and the Coefficient of Determination function. This quick analysis combo truly should be in your Excel Tool Belt!

Let’s say, for instance, that you want to do some speedy research into the efficacy of your sales advertising. Perhaps you want to know whether it is typically better to spend advertising dollars on Tuesday or Thursday.

First determine your ad effectiveness on Tuesdays by selecting data from those days and making a Scatterplot Chart.  Then do the following:

1. Right-click on one of the data points and
2. Choose Add Trendline
3. Right-click the Trendline and choose Format Trendline
4. Format the Trendline to your preferences and
5. Put a Checkmark next to Display R-squared Value on Chart

 
The R-squared value is your Coefficient of Determination (COD) that will tell you how strong your data on your two axes. In the example above, the COD value is .74 (or 74%) representing a strong correlation between spending advertising dollars on Tuesdays and increased sales.

Then simply do the same for your Thursday data, and compare the size of the CODs. If you get, for example, a Coefficient of Determination of 74% on Tuesday and 41% on Thursday, Hey, it’s a no-brainer!  Spend your money on Tuesdays!

Try using a Scatterplot and Coefficient of Determination sometime when seeking the strength of a correlation of data sets or multiple sets. It is Fast and Effective. Just don’t tell anyone how Easy it was!

Wednesday, November 12, 2014

Truly Blank?

Today’s topic may initially seem a bit obscure, but let me assure you, if you are ever faced with some odd results from what appears to be routine data, it is something to consider.  Let’s say that you have what appears to be a number of blank cells in the range on which you are performing a calculation.  If you are getting strange results, you might ask yourself, “Are the blank cells actually blank?”  The truth is that it is Not Always Easy to know whether a cell or cells in Excel are Truly Blank!

The reason it is difficult to immediately know if blank cells are truly blank is due to the fact there are several ways of Hiding Data through:

o   The use of identically-colored fonts

o   Empty-string results of a formula

o   Masking the data with the use of Custom Formatting (three semicolons: ;;; )

It can cause Mayhem with your calculations.

To detect this Invisible Data, there are at least a couple of techniques.  Assuming your cell in question is A1, you can:

1.      Simply insert this Function in an adjacent cell:  =ISBLANK(A1) 

o   If the cell is Blank, it will return True; if it is Not Blank, it will return False

o   Copy the simple formula to include the rest of the range you are investigating

2.      A second technique it the use an IF Statement as follows:  =IF(A1<>"","Not Blank", "Blank")

o   This IF Statement obviously returns Blank or Not Blank
 
o   You can then take the appropriate action with the Not Blank cells

By determining if your cells are Truly Blank, you can help Avoid Quirky Results on your worksheet.  And, as Martha Stewart might say, “That’s a good thing…”

Thursday, November 6, 2014

Keeping Things Safe

How many times have you heard or read that you should routinely back up your data on your computers?  Well, protecting your Excel work can be similarly important. 

Perhaps you are asking “Why is this important?” Maybe you have never done this, and never had a problem. That may be just fine if you are the only one using one of your Excel masterpieces, but if are sharing your work (and most of us probably are) with others there will come a time when the others will want to “Experiment” with your formulas and format. Don’t let this happen!  The construction of your workbook may have taken dozens of hours to create, and there is the potential for substantial ruin!

Happily, Excel has built-in Protection Tools to help us all out.

Let’s take a look at Excel 2013 for a How-To Example (other versions are similar):

Protecting and Unprotecting a Worksheet with a Password

1. If there are specific cells that you wish to enable users to modify (such as a Data Entry Range in a dynamic report), go to the Review tab and select the Allow Users to Edit Ranges in the Changes group and select the range you wish to keep accessible. In the example below, cells B5:B14…
2. Next, click the Protect Sheet button in the same dialogue box. Excel in turn opens a Protect Sheet dialog box (see below), where you can Assign a Password, and select the Permissions you wish to be available to the users.
3. Click OK

You can easily Unprotect the worksheet with the password anytime you wish to make changes. And, of course, as this can cause a business disaster (people have been fired for losing this), Be Sure to Keep Track of the Password. This should barely warrant mentioning, but it does happen.

One Last Important Note: Protecting your worksheets is Not making it absolutely Secure.  It is not ample protection to prevent users from accessing confidential or sensitive data, and any backyard hacker can break it.  It is for casual protection.

Protecting Your Worksheets.  Certainly a Best Practice for any Excel practitioner, and one worth your time. Give it a try, and find out how easy it is to add a bit of protection to your hard work.

Wednesday, October 22, 2014

The Advanced Filter

As you may well agree, there are a great many powerful gadgets in Excel that are seldom used.  The Advanced Filter is just one such example of an often-overlooked, but enormously useful tool.

The beauty of this tool is that it is, well, Advanced.  You can, however, use it in comparatively simple ways to get an immediate understanding of how it works.  We will take a look at a couple of examples of how to use the Advanced Filter.

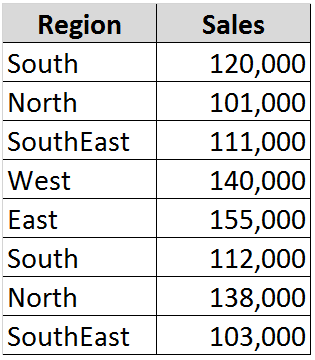
First of all, we will assume you have the following small database (keeping in mind, of course, that this tool works equally well with databases containing thousands of records):

 As is the case with any well-designed database, each field (column) has a header/name.  Not surprisingly, this is a necessity when using this tool.

Next, we will access the Advanced Filter by going to the Sort & Filter group on the Data tab, and clicking on Advanced. 

In the List range field put the location of your database (in this case it is B3: C11).

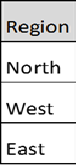
For the Criteria range, let’s assume you want to see all of the sales for the North, West, and East regions, and you want to place this filtered result below your database (use B13 for a starting point).  Simply set up a range such as in the following cells E3:E6 (or wherever you wish):

Your result will appear as follows in your chosen location:
Okay, Cool, but don’t stop there; you can use multiple field names and criteria to extract a wealth of information in a mere three clicks.

When you’re ready to Graduate up to another level, give the Advanced Filter a try.  I think you will like it!