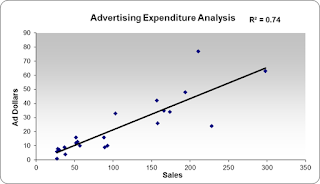
2) The Linear Trendline
3) The Coefficient of Determination
An (XY) Scatterplot Chart is commonly used to show the relationship between two variables or sets of data. For example, a sales manager could plot the number of sales calls taken with the number of sales made. Another example is comparing the average length of time a customer service representative takes per call and the overall quality score of their calls.
A Linear Trendline is a best-fit
straight line that is used with a majority of linear data sets.
The Correlation Of Data Function can
be an extremely worthwhile endeavor for any business analysts, as it represents
the strength and validity of your correlated data.
Before we go further, a word to the wise:
The old adage, “Correlation does not Imply Causation” is as true today as it
always has been, and continues to be a rebuttal to otherwise unscrupulous
statisticians.
So, how can we use these powerful tools?
Let’s say, for instance, that you want
to do some speedy research into the efficacy of your sales advertising. Perhaps you want to know whether it is typically
better to spend advertising dollars on Tuesday or Thursday.
First determine your ad effectiveness on
Tuesdays by selecting data from those days and making a Scatterplot Chart. Then do the following:
1. Right-click on one of the data points and
2. Choose Add Trendline
3. Right-click the Trendline and choose Format Trendline
4. Format the Trendline to your preferences and
5. Put a Checkmark next to Display R-squared Value on Chart

The R-squared value is your Coefficient of Determination (COD) that will tell you how strong
your data on your two axes. In the example above, the COD value is .74 (or 74%)
representing a strong correlation between spending advertising dollars on
Tuesdays and increased sales.
Then simply do the same for your
Thursday data, and compare the size of the CODs. If you get, for example, a
Coefficient of Determination of 74% on Tuesday and 29% on Thursday, it is a
strong indication that you should Spend
your money on Tuesdays!
Try using the combination of a Scatterplot
Chart, Linear Trendline, and a COD, and see how easy it is to do some very
worthwhile analysis.


No comments:
Post a Comment