
These
mysterious functions can be quite useful, however, and when you learn how they
are activated, you will laugh at how easy (albeit unusual) they are to use.
If
you want to do some analysis on how frequently values within
particular ranges occur (rather than looking at each individual occurrence),
for instance, an excellent
solution in Excel is the Frequency
Function. This valuable tool works
as an Array Function that counts the number of values that occur in
each specified interval (or “Bins”, as they are typically called).
The FREQUENCY Function syntax is as follows:
FREQUENCY(DataArray, BinsArray)
The function utilizes a database for a source, and is entered as an Array formula after you select a range of adjacent cells (B2:B7 in our example) into which you want the distribution to appear. After you select the data and bins arrays, press CONTROL+SHIFT+ENTER (this is what mystifies many users…).
The following example shows the “Bins” under the heading Size and the Frequency of claims within each range under Occurrences:
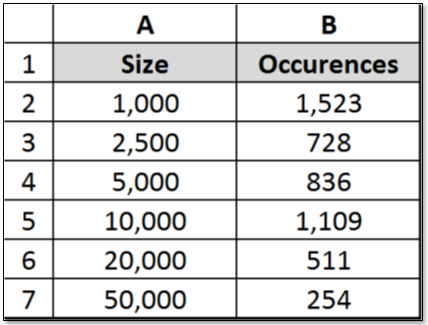
Special Note: The number of elements in the returned array is one more than the number of elements in bins array. The extra element in the returned array returns the count of any values above the highest interval.
Illustrations of key applications of the Frequency
Function will be explored in future blogs that will be published soon. In the meantime, take a 5-minute look at this
vital tool. You may find that it is not
all at mysterious…

No comments:
Post a Comment